When client report to you a performance issue in certain area on your system, you start troubleshooting and tackling the issue. the performance bottleneck might be everywhere on your system, it might be on front-end, business layer, data access layer, … etc. The scope of this article is to check the execution time taken for certain SQL statement till you get the result out from the DB. this would very helpful if the performance issue is at data retrieval. after figuring out the performance bottleneck is at data retrieval, the solution might be as easy as adding index for some of table’s columns. but in most cases you might get into a trouble of changing the body of SQL statements to have better performance. so you need a tool to assess your changes. SQL 2008 IDE shipped with a built-in tool that I found so much helpful and made my life much easier.
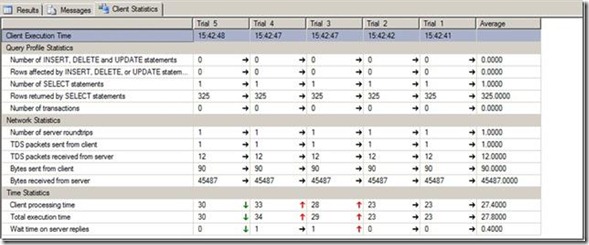
if you notice there is a small icon on tool bar called “Include Client Statistics”, it is by default not enabled. if you enable it and try to execute a sql statement, you will get a new tab at the result panel. below is snapshot of the new tab on the result panel
Notice the statics between different trials. it will keep the statics up to 10 trials. The statics including with some visual graphics to let you note the effect of your changes weather it increase the execution time or it reduced it.
Try it and you will find it so useful!


